How To Visualise And Change The Sensitivity Of The Touch Board's Sensors

The Touch Board has 12 electrodes that can be used as capacitive sensors and we’ve developed the Grapher as a tool to visualise the capacitance of these sensors. This is a great tool for observing the behaviour of the sensors and see if there is any noise or whether the sensors are triggered or not. If you are using a laptop, make sure the laptop is connected to power to avoid grounding issues.
You can also use the bar mode of the Grapher to change the sensitivity of an electrode and set it up between proximity and touch sensing.
Furthermore, the Grapher is also great for troubleshooting. If you feel like your sensors aren’t responding, for example if you have painted connections with Electric Paint, then you can figure out where along the line it starts to lose signal. Or you can see if there is noise anywhere in your design.
If you are doing this tutorial for the first time, you probably need to set up the Grapher first, so just continue below. If you have set it up before, you can skip to the next part.
We love it when you share your projects! Post your project on Instagram, YouTube, or Twitter, and make sure to tag @bareconductive or use #bareconductive. You can also send your videos and photos to info@bareconductive.com so we can post them on our site for the world to see.
You will need:
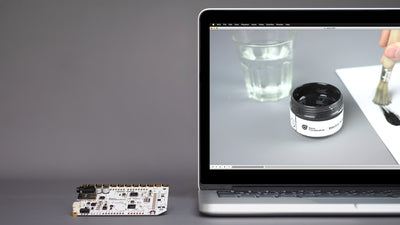
1 x Touch Board
Set up the Grapher
First, you need to download Processing, if you haven’t installed it yet. Once downloaded, open and close it once so that it generates the necessary files.
Then, download our Grapher. Unzip the file and move the folder “mpr121_grapher” to the corresponding location:
Windows
Libraries\Documents\Processing
or
My Documents\Processing
Mac
Documents/Processing
Linux (Ubuntu)
Home/Processing
With the folder in place, open Processing and open the Grapher sketch, by heading to
File→Sketchbook
and then opening “mpr121_grapher”.
Next, you need to install two libraries for the Grapher, controlP5 and oscp5. In Processing, head to
Sketch→Import Library→Add Library…
In the search field, look for the two libraries and then click “Install”. You're ready to run the code!
Update the code on the Touch Board
First, if you are using a laptop, make sure to have it connected to power, otherwise, you might experience some grounding issues.
In this example we are using the "Touch_MP3" code of the Touch Board. In the code, look out for
const bool MPR121_DATASTREAM_ENABLE = false;
in the Arduino IDE and change it to
const bool MPR121_DATASTREAM_ENABLE = true;
Upload the updated code to the Touch Board, making sure that you have selected the right settings for the Touch Board.
Most of our code examples has the MPR121_DATASTREAM_ENABLE setting, but if it doesn't, you won't be able to use the Grapher in the particular code.
Run the Grapher
With your Touch Board plugged in, go back to Processing and run the Grapher sketch. Select your Touch Board from the dropdown menu that appears in the window. You’ll probably have a number of choices, but generally, the device is the last or near the end of the list, named something like “/DEV/CU.USBMODEM…”
You’ll know you’ve selected the right serial port when you see a scrolling display of data. Touch electrode 0 and you should see a reaction that shows the change in the electric field of the sensors as a touch event. You can also view the data from other electrodes, either by selecting them from the dropdown menu or by using the arrow keys.
Access the different modes
If you click “Help” you can see all the possible commands for the Grapher.
By pressing “S”, you can view the solo mode where you only see the touch and release events on black and white.
Try pressing “B” on your computer, you should see 12 red bars, which are the capacitive sensors of the Touch Board. Touch any of them and see the red bar dropping and turning white. This means the board is registering an event. So now you can see all of the sensors at once.
The bar mode is also the mode where you can change the sensitivity of an electrode. If you now click and drag one of the bars, you can see a dark green and a yellow line being moved along. These are the touch and release thresholds of a sensor and are saved in your Touch Board, so if you turn the Touch Board off and on, it will have the same threshold values as you set them in the bar mode, they remain constant.
Reset the Touch Board
Whenever you attach something to the electrodes of the Touch Board, you need will need to reset the board. The Grapher is also able to reset the Touch Board, so that if you connect something to the electrodes, you don’t need to manually turn the board off and on again. Instead, you can do it by clicking the “Reset” button at the top.
Retrieve the data
If you press “D”, you can export all of the data of the sensors. At the time of writing this tutorial, the feature is in development, so for now it’s simply a CSV file.